Pipeline shows your lead funnel and deal economics from one live payload, so every number on the screen agrees with itself. It answers: where are leads getting stuck, which deals are slipping, and where is conversion strong or weak? The view has three tabs — Lead Funnel, Deal Pipeline, and Analytics — that share the same underlying data.
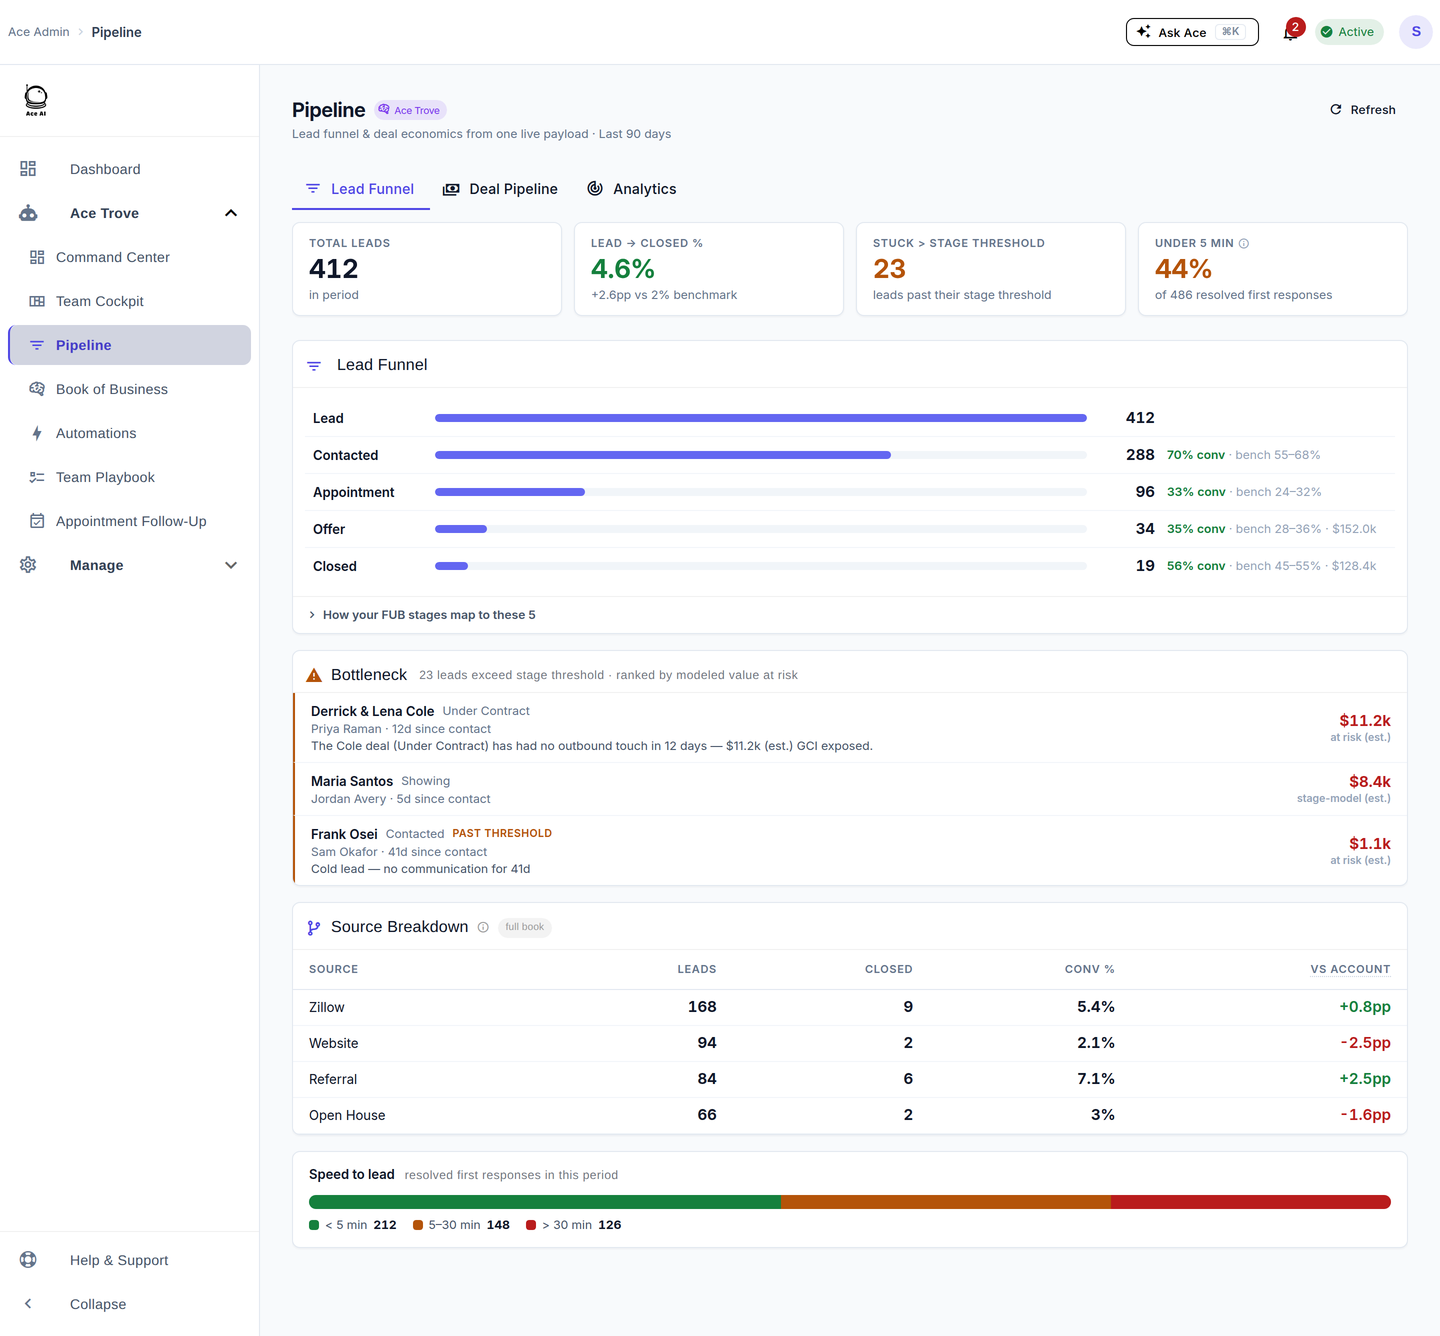
The Lead Funnel: conversion at each stage versus your own benchmark, plus the bottleneck ranked by value at risk.
Lead Funnel tab
The funnel collapses your custom Follow Up Boss stages into five milestones — Lead, Contacted, Appointment, Offer, Closed — and shows the conversion rate at each step against your own benchmark range. The appointment milestone is measured from real appointment outcomes, not stage-name guessing. Below the funnel, the Bottleneck lists leads past their stage threshold, ranked by modeled value at risk, with the same reason strings and dollar figures you see in Command Center. "How your FUB stages map to these 5" shows the mapping.
Deal Pipeline tab
Per-pipeline deal-stage lanes, each showing count, value, and GCI, plus median days-in-stage, advance % / lost %, and a projected close (est.). You also get a dated next-projected-closings list (distinguishing a real FUB date from an estimate), a weighted forecast, and a model-weighted pipeline — open-deal value weighted by each linked contact's calibrated win probability.
Analytics tab
Source breakdown — leads, closed, and conversion % by source, each with a delta versus the account average — plus a speed-to-lead distribution. Use it to see which lead sources actually convert for your team.
Five things to do here
- Find the leak. Read the funnel top-to-bottom; the stage with conversion below its benchmark is where to focus coaching.
- Rescue the bottleneck. Work the ranked bottleneck list biggest-dollars-first.
- Sanity-check the forecast. Compare the weighted forecast to the model-weighted pipeline on the Deals tab.
- Judge your sources. On Analytics, cut spend on sources converting well below your average and double down on those above it.
- Confirm the stage mapping. Expand "How your FUB stages map to these 5" so the funnel reflects your real pipeline.
Frequently asked questions
Where did the separate Lead Funnel / Deal Pipeline / Pipeline Analytics menu items go? They're now the three tabs on this one Pipeline view; the old URLs redirect here. See Where Did My Menu Items Go?
Does Ace understand my custom stage names? Yes — it maps your team's custom FUB stages into the five funnel milestones and tracks appointments as real outcomes (set / held / no-show).
Why do some bottleneck rows say "stage-model (est.)"? That row's value is a stage-model estimate rather than a matched Command Center alert — it's labeled honestly so you know the basis.
Related articles
Was this article helpful?
That’s Great!
Thank you for your feedback
Sorry! We couldn't be helpful
Thank you for your feedback
Feedback sent
We appreciate your effort and will try to fix the article